
What's with this weather? |
|
It’d been an odd and windy winter and spring back in 2010. When miserable weather days happen, flight instructors offen amuse themselves looking at...the weather. One day, I received this weather chart that someone found on Weather.com. It’s an amazing morass of isobars. |
|
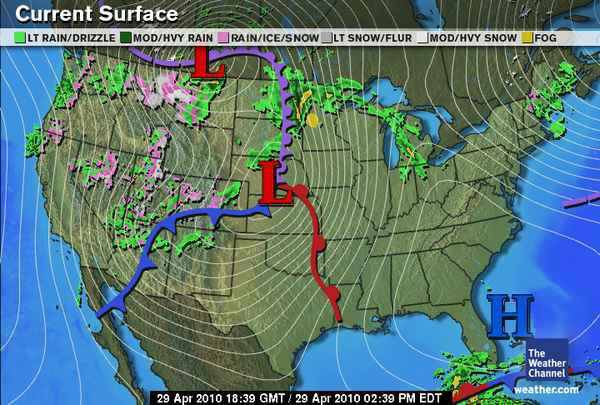
Remember, isobars are lines that connect reporting stations (a fancy word for places that take official weather readings) that have the same barometric pressure. Typically, isobars are drawn at 4 millibar intervals. When the isobars are spaced closely together, there is a strong barometric pressure difference over a small geographic area. This results in strong winds. At about the valid time of the above chart, this was the METAR (hourly observation) and TAF (Terminal Area Forecast) for KTCS. The real name of KTCS: Truth or Consequences, New Mexico. KTCS 291853Z AUTO 24042G59KT 8SM CLR 24/M07 A2946 RMK AO2 PK WND 23059/1849 SLP892 T02391072 TSNO For those wishing for the translation:
Apparently, the forecast wasn't too far off! KTCS 291729Z 2918/3018 25028G40KT P6SM FEW100 TEMPO 2920/2924 25038G50KT Here’s a link to AirNav.com where you can see the rest of the sectional chart (shown below) for the area, which you may also find the chart on SkyVector.com. 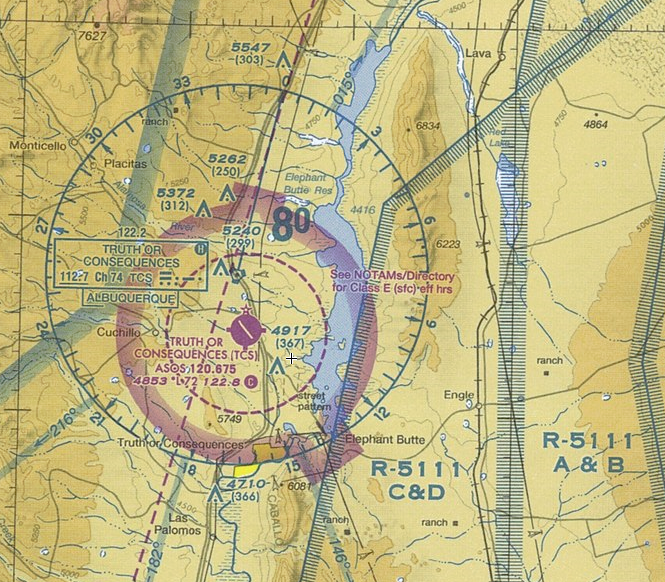
Article by: Terry Keller Jr. |
|